


Flatten the Curve
Welcome to part three of our pandemic series! Part one on pandemics in antiquity can be found here. Part two, on the 1918 Flu pandemic can be found here.
Now that we’ve gotten ourselves a little context for the past history of pandemics, it’s time to dig into what’s actually going on right now! Because of the sheer amount of information that we have on the COVID19 pandemic, I’m going to have to break the content up a little bit. Eventually, we’ll get to MERS and SARS, related zoonotic coronaviridae (saying that last bit ten times fast summons the WHO). Even more eventually, I’ll circle back to talk about OTHER fascinating pandemics - encephalitis lethargica, hemorrhagic fevers, HIV/AIDs.
But today we still dealing with COVID, and we’re going to start at the (apparent) beginning. This article is going to cover the following macro-scale activity surrounding the virus:
Origins of the pandemic
early responses to the pandemic
apparent illness dynamics
effects of early responses
what’s in store for the world
This is an orientation. First we understand the apparent progression of the pandemic. Then, in subsequent articles, we’ll take a look at all micro stuff - routes of infection, identification of the virus, treatment pipelines, etc.
One other thought, if you’d like to read something peer-reviewed: a good starting point for understanding what’s happened since late December of 2019 has been written up by Velavan and Meyer. Short, sweet, and informative - but a month out, take the numbers with a grain of salt.
How did this happen?
At this point, the start of the story might be familiar to some, but it’s worth starting at the beginning.
On December 30, ophthalmologist Dr. Li Wenliang of the city of Wuhan notices a cluster of patients quarantined for pneumonia. They are all vendors at the nearby Huanan Seafood Wholesale Market, and have been identified as testing positive for SARS-related antibodies. There’s a strange feeling that this triggers, as there hasn’t been any sort of information released, even internally, at the hospital about a return of a SARS outbreak.
A new SARS epidemic would be a big deal in China, which saw a nearly 10% mortality rate from the outbreak in 2003. Coupled to the fact that the government lost precious time denying the reality of the outbreak, Dr. Li takes it upon himself to spread the word to his colleagues. A litmus test, of sorts. Is there good reason to be worried?
The evening of December 30, Dr. Li sends a message to a WeChat group of Wuhan University Alumni, mistakenly suggesting that the quarantined patients have been confirmed to carry the SARS virus. He corrects himself in an hour, updating his colleagues that it isn’t SARS, it’s another coronavirus, one that hasn’t been seen before. But it’s too late. Someone in the group has sent a screencap of the conversation out into the wider world, and Dr. Wenliang is now the unwilling center of an entire thing.
It doesn’t take very long for the thing to spiral. He’s called to a meeting with his hospital administration in the middle of the night, and on January 3rd, the authorities get in touch. He apologizes for his role in the entire thing, signing his name with a red thumbprint after each statement.
From the Economist:
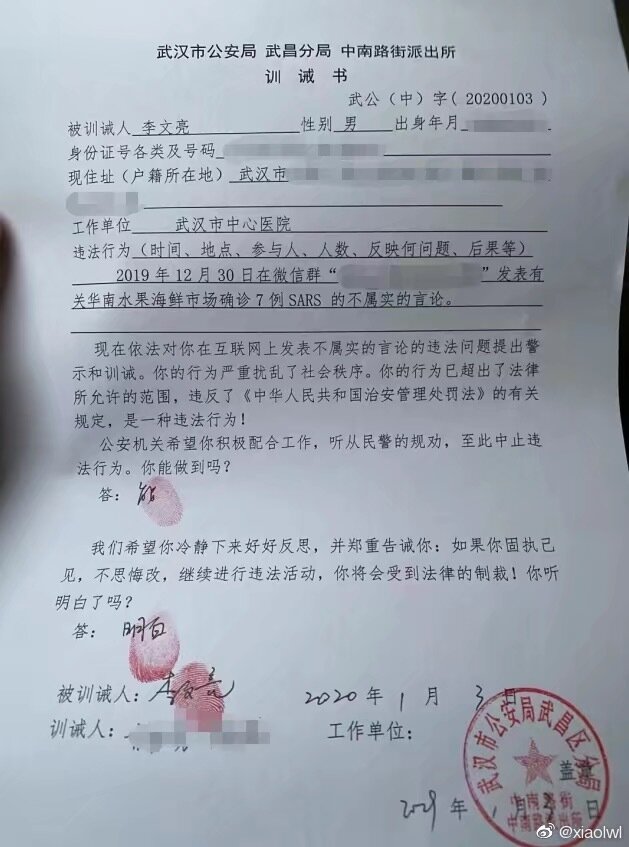
[at] the police station…he was accused of spreading rumours and subverting the social order. He then had to give written answers to two questions: in future, could he stop his illegal activities? “I can,” he wrote, and put his thumbprint, in red ink, on his answer. Did he understand that if he went on, he would be punished under the law? “I understand,” he wrote, and supplied another thumbprint.
Chagrined, he returns to work at the hospital, where he continues seeing patients. On January 8th he sees an 82 year old woman. She’s a vendor at the seafood market, and has not yet been diagnosed with the virus. Unbeknownst to Dr. Li, she is carrying a high viral load. By January 10th he is coughing. February 7th, At 2:38 AM Dr. Li Wenliang dies of the virus.
While he convalesces, the entire country of China undergoes a massive reckoning with this new viral infection. Little is known about it at first - just that it is part of the coronavirus family, that it hasn’t yet been characterized, and that people are starting to get sick and die. The first wave of infections had a 2.5% mortality rate. The number of confirmed cases jumped from ~100 on January 10th to more than 2000 on January 22nd. That’s a 20X increase in less than two weeks.
This kind of growth is due to the rate at which an organism replicates. If each organism can only give rise to one more (or less) of itself before dying, the population will stay steady or even decrease.
When a single organism can double its numbers, then you get something that’s called exponential growth. Bacterial follow this growth curve quite neatly, since their number doubles at each generation. Human populations in the past have also undergone exponential growth.
The hard numbers on this kind of growth don’t totally matter - it’s more that there’s a pattern we can observe that results in significant increases from baseline. Here’s two generic curves that show exponential growth:

Even starting from a single organism (or a small number with humans) you get huge increases in the exponential growth. Math warning! An exponential is number larger than 1, raised to the number of generations (n).
We can look at the progression of the epidemic in China, and see that the number of infected individuals there closely followed an exponential growth curve. The number of cases by day can be seen this chart from Wu et al:
Early dynamics of COVID-19, taken from a sample of 44,672 patients with a confirmed infection. Peer-reviewed article here.
There are two different colored bars on this graph - a slate grey and an orange. The difference between them represents the lag between initial experience of symptoms and clinical diagnosis using a standard nucleic acid assay that’s capable of identifying the presence of SARS-Cov-2, the coronavirus responsible for the COVID-19 outbreak.
The point I’m trying to make is that the initial rate of increase here is astonishing - the cases in December are so few that they need to be represented with an inset zoom. By late January, there are more than 2800 confirmed cases. On January 23rd, ten days after official COVID test kits became available, the Chinese government announced that they were ready to stop the epidemic, at any cost.
How to stop a virus in its tracks
The speedy growth of infected patients comes down to the rate of transmission. A disease that’s deadly but poorly transmissible can be less of a concern than one that’s much less deadly but transmits quickly. One of benchmarks for evaluating what transmission looks like is called R0, pronounced “R naught.” This represents the basic reproduction number of a disease, and is a rough estimate for how difficult an oubtreak is going to be to control. Measles has an R0 of 12-18. Ebola sits at 2.5, and MERS is down at 0.8. You can read a little more about the efficiency of contagion of various diseases here at PopSci.
In early January, it looked like each infected individual was infecting somewhere between 2-4 new people. The coronavirus that emerged in Wuhan in early January was a wildcard. It was evident that it was a fast spreader, but it was unclear how deadly it would prove to be. The Chinese government hedged their bets, and made a difficult and drastic decision.
Starting on 10 AM January 23rd, all inhabitants of Wuhan were prevented from leaving the city - highways were barricaded, airports closed, trains and buses sat idle in the stations. Wuhan, at 11 million people, is roughly the size of New York City. These photos of the emptied city are quietly eerie, like seeing Time Square or Grand Central completely silent on a weekday afternoon. On January 24th, slightly more relaxed quarantine measures were announced for 15 more cities in Hubei province. In total, over the course of two days, the movements and habits of close to 60 million people were severely restricted.
Was it worth it?
On some level, I would say so. Given the speed at which people fall sick, and the necessity of specialized medical care for many moderate and critical cases, forced social distancing relieves the stress placed on a hospital system when five thousand new patients appear in less than a month.
The numbers for new infections in China have tanked:

A summary of how the rate of new cases has fallen in Hubei Province since February 18. Full story here.
What’s unknown is how these numbers will respond to the relaxation of quarantines and travel restrictions. It’s best to keep an eye on it for now, and assume that voluntary implementation of social distancing measures is the best way to get this under control.
The sentiment on the ground, among those that have had to bear the burden of a long quarantine is mixed. This is especially true for those from Wuhan. In addition to the sickness and mortality, they’re dealing with the fact that their wellbeing was sacrificed in the early days of the epidemic. Fang Fang, a Wuhan-based writer, underlines the stress pervading the community at all levels - from the silencing of Dr. Li Wenliang, to the deaths of healthcare workers:
Yeah, Li Wenliang's business is a knot. In fact, the casualties of the Central Hospital are also a knot. If the knots of each one are not unlocked, the knots of Wuhan people will also be difficult to untie. The longer the time, the tighter the knot will become, the more complicated it becomes, and the wounds and depth of the heart will also expand and deepen. Psychological consultants say that as the danger is lifted, real trauma will surface. In simple words, you have to give Li Wenliang a statement, and to the central hospital, you have to give us a statement.
These knots will take a long time to untie, and will require a careful study of the history and trajectory of the infections in order to evaluate it. Understanding how the virus progresses outside the country is the next step in evaluating the kinds of approaches that are necessary for halting the progression of a pandemic.
What now?
One of the best things about being alive in 2020 is how much data we have access to, and how quickly we have access to it. Worldometers.info, a website after my own heart, has a bunch of graphs about what’s happening with the epidemic all around the world. Lets take a look.


Up on the top left, we have data about the number of cases in China from the start of the quarantine through today. Next door, the same data is shown on a logarithmic scale. On a log scale each unit is a 10x increase than the one above (1,10,100,1000), rather than a linear plot where each next unit is at some set interval (1,2,3,4,5).
On the top right, we have two graphs showing the total number of deaths in China. They, too, have slowed. This is consistent with the data we have coming from the CDC. It remains to be seen what happens when the quarantine restrictions are lifted, children go back to school, and adults go back to work.
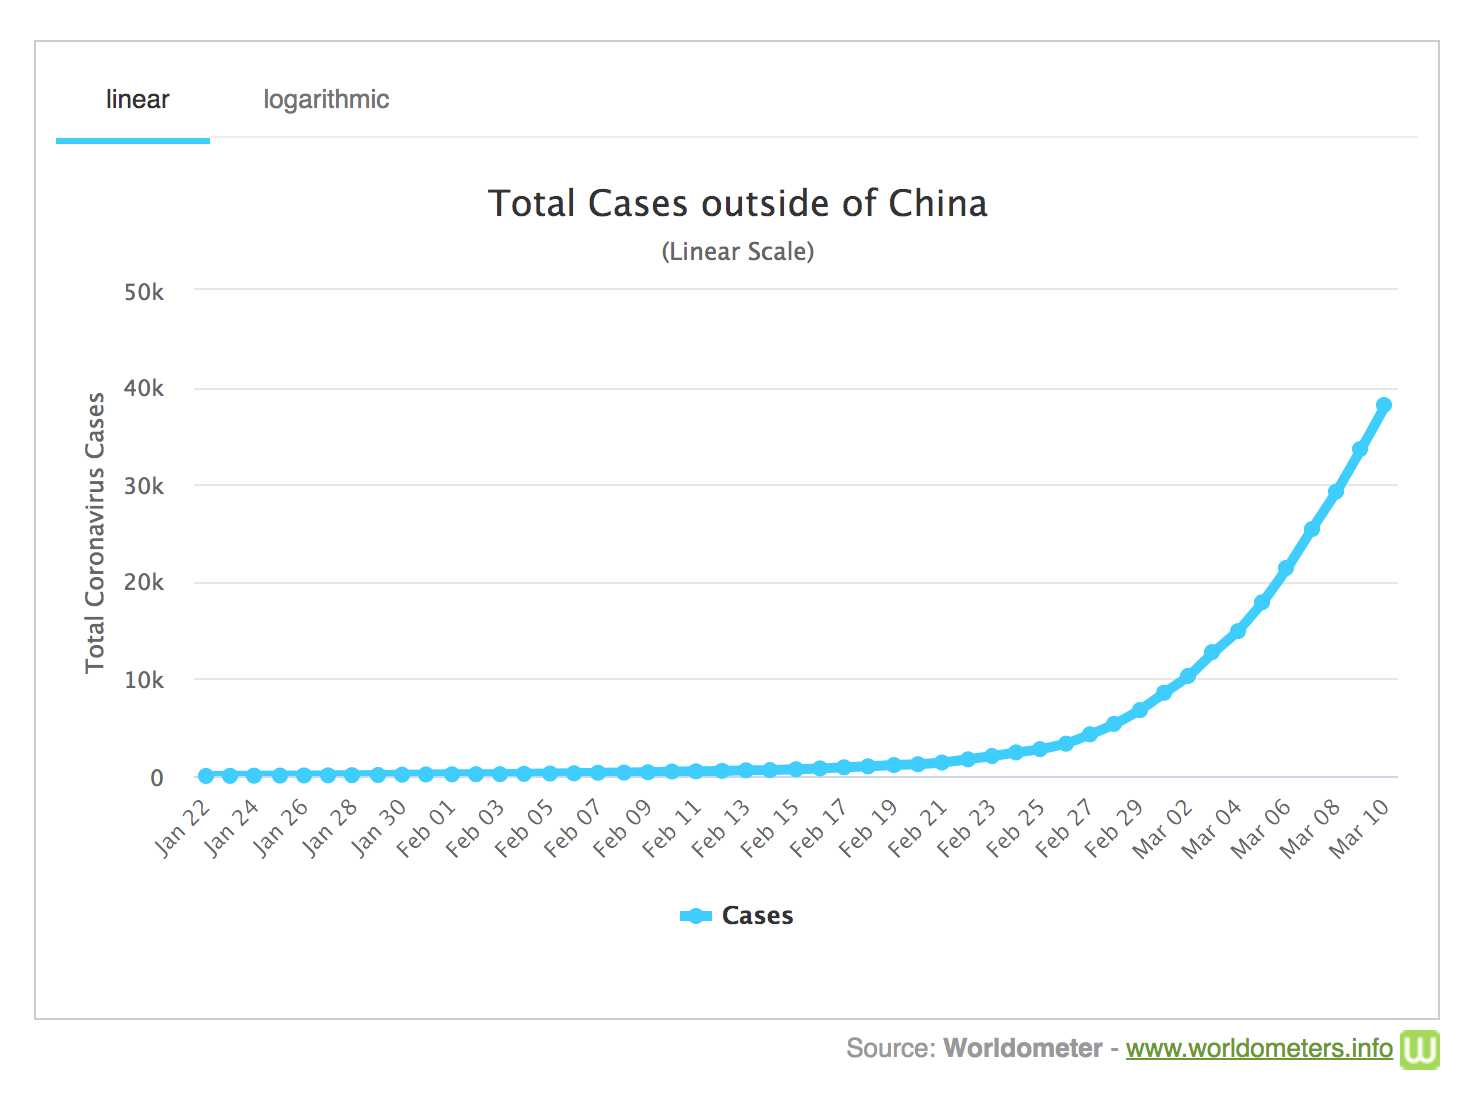
Down on the bottom the numbers start to get more relevant for what’s coming our way. The total number of cases vs the total number of deaths is on the bottom left. The increase has flattened significantly over the course of February, but the log scale graph shows a little uptick, a sign of increased contagion in other countries like Italy, South Korea, and Iran. The BBC has a head-spinning graphic on the rate of increase outside of China. Take a second to go look at it, it’s worth it.
Okay welcome back!
The number of cases outside of China are increasing, and social distancing is now upon us, since few other governments are willing to take the sort of measures that would put their entire population on lockdown.
The best we can do is to “flatten the curve.” One of the greatest problems in China was the fact that there were simply more people getting sick than the hospital system could accommodate. If we take steps to prevent the spread of the virus, then the rate at which people fall sick and need serious medical intervention will slow significantly. A slower rate of new cases means a greater chance that each individual will receive timely care.
You don’t have to even do that much in order to help this along. Take simple preventative measures - not touching your face, washing your hands, and staying home from work when you’re sick. This infographic shows what happens relative to the capacity of the healthcare system if we’re all careful:

Takeaway
China, the first country to encounter the SARS-CoV-2 virus, has seen 80,796 cases from Dec 31 to March 12. Through widespread quarantine measures, they were able to get new cases of the virus down from thousands a day to less than 50. Mortality rate for the virus in Wuhan is 5.8%, but is closer to 3.5% in other, less affected areas.
It remains to be seen what the effect lifting the quarantine will have across China.
Italy, Iran, and South Korea are facing serious outbreaks. Watching how they deal with them will be most informative for other countries that are not yet approaching peak infection levels.
Best thing you can do is stay home, don’t panic buy, and wash your damn hands.
It’s worth remembering that it has been much worse in the past. During the Black Death in Europe, 25% of the population died. During the epidemics brought by the colonists, something like 95% of the American Natives died. This doesn’t even start to deal with silent pandemics, devastation in other species that pass us by without even triggering our attention.
This is an opportunity to come together, to help the old, the weak, the vulnerable. It’s a chance to really look into our economic systems and consider what humane capitalism looks like.
I know it’s frightening and uncertain, but we will prevail - and be more informed for it.
That’s all for now - the next episode in the pandemic series will deal with coronaviruses - MERS, SARS, previous pandemics, and what makes SARS-CoV-2 so infectious.
If you want to check out the article on pandemics in antiquity it is here. Article on the spanish flu is here.


